
Analytic Analysis
There are various reports designed for financial analysis based on the analytic accounts. Most of these reports are available directly from the tree of analytic accounts or from the form view of the analytic account.
From the Accounting > Configuration > Analytic Accounting > Analytic Accounts menu, select one or more analytic accounts and then click one the Print button at the centre of the screen. Odoo ERPOnline provides the following financial analyses from the analytic accounts (and maybe more, depending on the additional installed modules):
- Cost Ledger.
- Inverted Analytic Balance.
- Cost Ledger (only quantities).
- Analytic Balance.
The Cost Ledger
The cost ledger provides the entries in general accounts for the selected analytic account(s). It enables you to make a detailed analysis of each operation carried out on one or several projects.
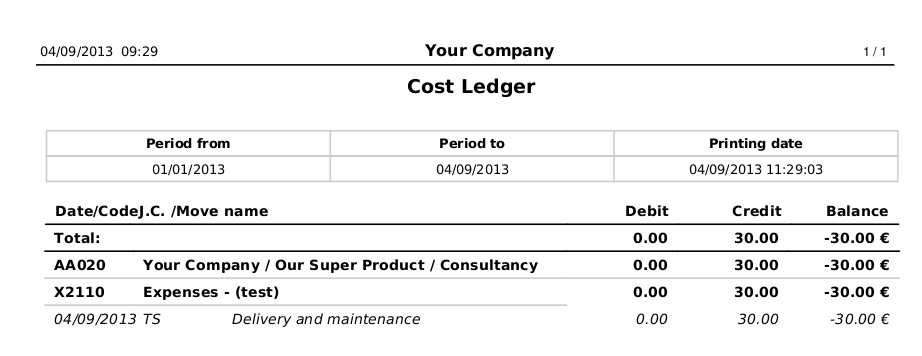
Cost Ledger
Inverted Analytic Balance
The inverted analytic balance provides a summary report relating general accounts and analytic accounts. This report shows the balances of the general accounts broken down by the selected analytic accounts from date / to date.
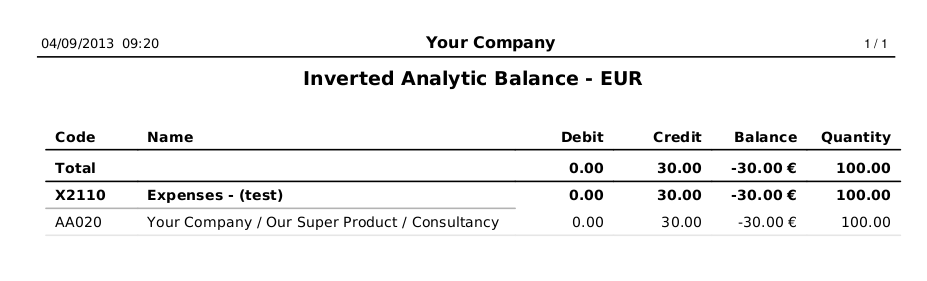
Inverted Analytic Balance
This enables you to analyse your costs by general account. For example, if you examine your general account for staff salaries, you can obtain all your salary costs broken down by the different analytic (or project) accounts.
The Cost Ledger (Quantities Only)
This report gives the details of entries for an analytic account and a list of selected journals. Only quantities are reported for this analysis, not costs and revenues. In the wizard you can select from period and to period and one or more journals.
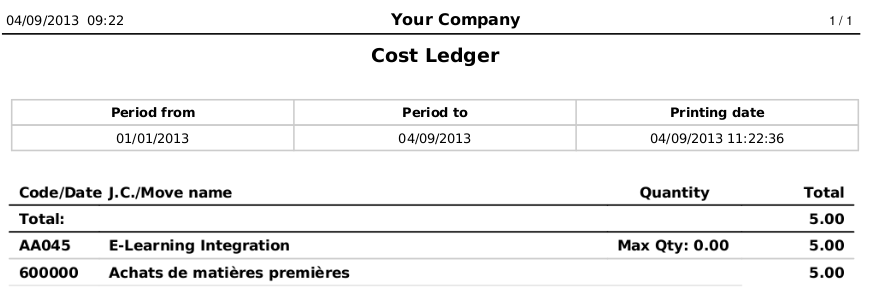
Cost Ledger with Quantities Only
The report is often used to print the number of hours worked on a project, without exposing the costs and revenues. So you can show it to a customer as a record of the hours worked on a particular project.
To restrict the report to hours worked, without including sales and purchases, select only the services journal in the printing options.
To print several analytic accounts at once, you can make a multiple selection on the different accounts in the list of accounts. Then click the appropriate Report in the Print dropdown` button, to export the whole selection into a single PDF document.
Analytic Balance
The analytic balance is a summary report that relates the analytic accounts to the general accounts. It shows the balances of the analytic accounts broken down by general account for a selected period. The analytic balance allows you to display a breakdown of each project by operation in the general accounts. Quantities are printed too. You can choose to include accounts without a balance as well.
When you select the analytic chart itself (the main analytic account), you can print the analytic balance for the entire analytic chart of accounts.
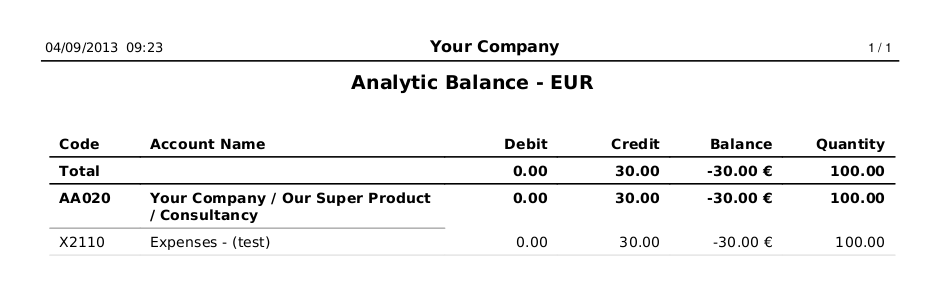
Analytic Balance
This report gives you the profitability of a project for the different operations that you used to carry out the project.
In a multi-company environment, each company can have its own general chart of accounts on the same database. The two general charts of accounts are independent, but can be linked in a third chart using a view account to do the consolidation.
If the different companies collaborate on joint projects, they may all share the same analytic chart of accounts. In this environment, the cross-related reports like the balance and inverted balance are extremely useful, because they enable you to make an analysis per company by linking up to the general accounts.
Analytic Journals
From the Accounting > Configuration > Analytic Accounting > Analytic Journals, select one or more analytic journals and click the Print > Analytic Journal report at the top of the screen. This prints a report per analytic journal from debit and credit (general account versus analytic account).
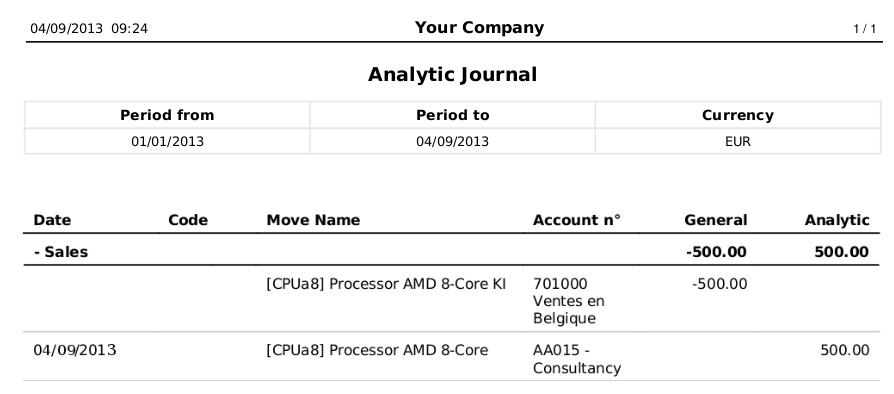
Analytic Sales Journal
Analytic Entries Analysis
You can have the statistical analysis on all analytic entries from the menu Reporting > Accounting > Analytic Entries Analysis. By default, analytic entries are grouped by analytic account and month, but you have many options to sort and regroup analytic entries. You can, for instance, first group the information by general account, then by analytic account.
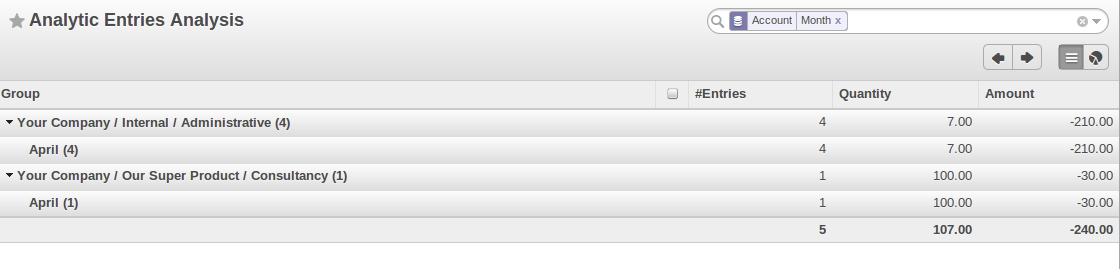
You can easily turn this analysis screen into a graph by clicking the Graph view at the top right of the screen.