
Purchase Analysis through Analytic Accounts
Powerful Statistics
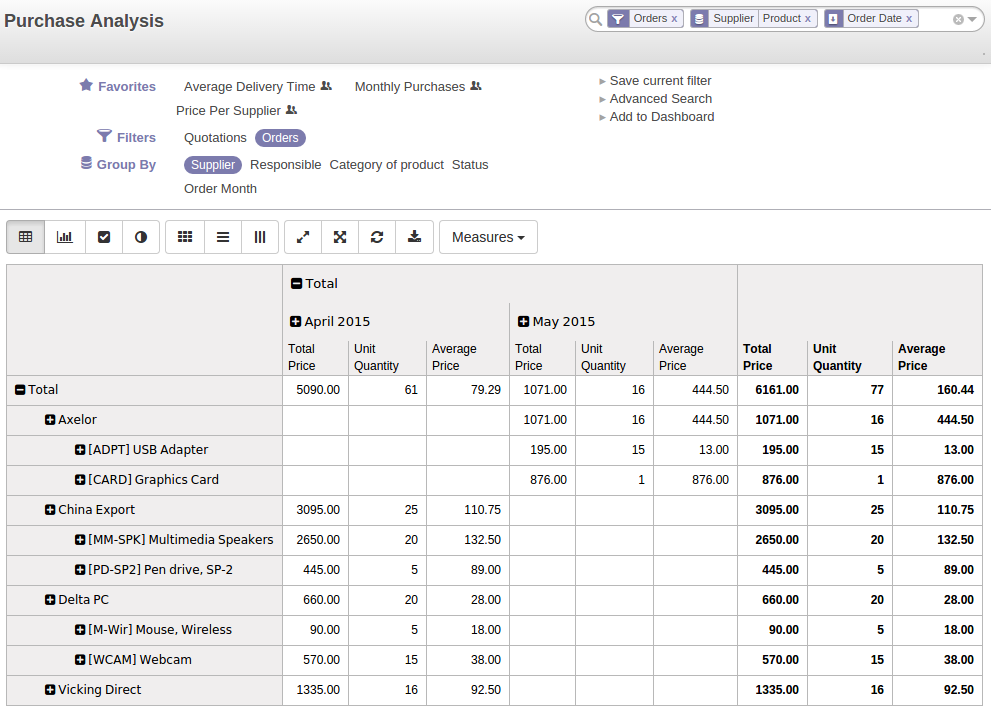
Odoo ERPOnline enables you to perform analysis of purchases by period (year, month), by state (quotations, orders), supplier, product, category, warehouse and so on. This is made possible through a search view accessed through the menu Reporting > Purchase > Purchase Analysis.
Analysis of Purchases
This analysis is carried out on supplier orders and not on invoices or the quantities actually received. To get an analysis by product, use the module product_margin. The function of this module is described in detail in Sales Margins.
To analyze the received quantities, you can use the statistical reports in Warehouse.
To manage purchases by project, you should use analytic accounts. You can set an analytic account on each line of a supplier order. The analytic costs linked to this purchase will be managed by Odoo ERPOnline from the goods receipt and confirmation of the supplier invoice.
The hr_timesheet_invoice module lets you re-invoice the analytic costs automatically using parameters in the analytic accounts such as sale pricelist, associated partner company, and maximum amount.
So you can put an invoice order with a defined invoice workflow in place based on the analytic accounts. If you are working Make to Order, the workflow will be:
- Customer Order,
- Procurement Order on supplier,
- Receive invoice and goods from the supplier,
- Delivery and invoicing to the customer.
When re-invoicing based on costs you would get the following workflow:
- Enter the customer contract conditions from the analytic accounts,
- Purchase raw materials and write the services performed into the timesheets,
- Receive the supplier invoice and the products,
- Invoice these costs to the customer.
If you want several analysis plans, you should install the module purchase_analytic_plans. These let you split a line on a supplier purchase order into several accounts and analytic plans.
You need a common way of referring to each user, service, or document to integrate all your company's processes effectively. Such a common basis is provided by analytic accounts (or management accounts, or cost accounts, as they are also called) in Odoo ERPOnline.
Analytic accounts are often presented as a foundation for strategic enterprise decisions. But because of all the information they pull together, Odoo ERPOnline's analytic accounts can be a useful management tool, at the center of most system processes.
There are several reasons for this:
- they reflect your entire management activity,
- unlike the general accounts, the structure of the analytic accounts is not regulated by legal obligations, so each company can adapt it to its needs.
In some software packages, analytic accounts are managed as an extension of general accounts – for example, by using the two last digits of the account code to represent analytic accounts.
In Odoo ERPOnline, analytic accounts are linked to general accounts but are treated totally independently. So you can enter various different analytic operations that have no counterpart in the general financial accounts.
While the structure of the general chart of accounts is imposed by law, the analytic chart of accounts is built to fit a company's needs closely.
Just as in the general accounts, you will find accounting entries in the different analytic accounts. Each analytic entry can be linked to a general account, or not, as you wish. Conversely, an entry in a general account can be linked to one, several, or no corresponding analytic accounts.
You will discover many advantages of this independent representation below. For the more impatient, here are some of those advantages:
- you can manage many different analytic operations,
- you can modify an analytic plan on the fly, during the course of an activity, because of its independence,
- you can avoid an explosion in the number of general accounts,
- even those companies that do not use Odoo ERPOnline's general accounts can use the analytic accounts for management.
Unlike general accounts, analytic accounts in Odoo ERPOnline are not so much an accounting tool for Accounts as a management tool for everyone in the company. (That is why they are also called management accounts.)
The main users of analytic accounts should be the directors, general managers and project managers.
Analytic accounts make up a powerful tool that can be used in different ways. The trick is to create your own analytic structure for a chart of accounts that closely matches your company's needs.
To Each Enterprise its own Analytic Chart of Accounts
To illustrate analytic accounts clearly, you will follow three use cases, each in one of three different types of company:
- Industrial Manufacturing Enterprise.
- Law Firm.
- IT Services Company.
Case 1: Industrial Manufacturing Enterprise
In industry, you will often find analytic charts of accounts structured into the departments and products that the company itself is built on.
So the objective is to examine the costs, sales and margins by department and by product. The first level of the structure comprises the different departments, and the lower levels represent the product ranges that the company makes and sells.
Analytic Chart of Accounts for an Industrial Manufacturing Company
- Marketing Department
- Commercial Department
- Administration Department
- Production
- Product Range 1
- Sub-groups
- Product Range 2
In daily use, it is useful to mark the analytic account on each purchase invoice. The analytic account is the one to which the costs of that purchase should be allocated. When the invoice is approved, it will automatically generate the entries for both the general and the corresponding analytic accounts. So, for each entry on the general accounts, there is at least one analytic entry that allocates costs to the department that incurred them.
Here is a possible breakdown of some general accounting entries for the example above, allocated to various analytic accounts:
| General accounts | Analytic accounts | |||||
|---|---|---|---|---|---|---|
|
Title |
Account |
Debit |
Credit |
Account |
Value |
|
|
Purchase of Raw Material |
600 |
1500 |
Production / Range 1 |
-1 500 |
||
|
Subcontractors |
602 |
450 |
Production / Range 2 |
-450 |
||
|
Credit Note for defective materials |
600 |
200 |
Production / Range 1 |
200 |
||
|
Transport charges |
613 |
450 |
Production / Range 1 |
-450 |
||
|
Staff costs |
6201 |
10000 |
Marketing |
-2 000 |
||
|
Commercial |
-3 000 |
|||||
|
Administrative |
-1 000 |
|||||
|
Production / Range 1 |
-2 000 |
|||||
|
Production / Range 2 |
-2 000 |
|||||
|
PR |
614 |
450 |
Marketing |
-450 |
The analytic representation by department enables you to investigate the costs allocated to each department in the company.
So, the analytic chart of accounts shows the distribution of the company's costs using the example above:
| Account | Total |
|---|---|
|
Marketing Department |
-2 450 |
|
Commercial Department |
-3 000 |
|
Administration Department |
-1 000 |
|
Production |
-6 200 |
|
Product Range 1 |
-3 750 |
|
Product Range 2 |
-2 450 |
In this example of a hierarchical structure in Odoo ERPOnline, you can analyze not only the costs of each product range but also the costs of the whole of production. The balance of a summary account (Production) is the sum of the balances of the child accounts.
A report that relates both general accounts and analytic accounts enables you to get a breakdown of costs within a given department. An analysis of the Production / Product Range 1 department is shown in this table:
| Production / Product Range 1 | |
|---|---|
|
General Account |
Amount |
|
600 – Raw Materials |
- 1 300 |
|
613 – Transport charges |
- 450 |
|
6201 – Staff costs |
-2 000 |
|
Total |
-3 750 |
The examples above are based on a breakdown of the costs of the company. Analytic allocations can be just as effective for sales. That gives you the profitability (sales - costs) of different departments.
This analytic representation by department and by product range is usually used by trading companies and industries.
A variant of this is not to break it down by sales and marketing departments but to assign each cost to its corresponding product range. This will give you an analysis of the profitability of each product range.
Choosing one over the other depends on how you look at your marketing effort. Is it a global cost allocated in some general way, or does each product range have responsibility for its own marketing costs?
Case 2: Law Firm
Law firms generally adopt management by case, where each case represents a current client file. All of the expenses and products are then attached to a given file.
A principal preoccupation of law firms is the invoicing of hours worked, and the profitability by case and by employee.
Mechanisms used for encoding the hours worked will be covered in detail in the following chapter, Key Features HR. Like most system processes, hours worked are integrated into the analytic accounting. Every time an employee enters a timesheet for a number of hours, that automatically generates analytic accounts corresponding to the cost of those hours in the case concerned. The hourly charge is a function of the employee's salary.
So a law firm will opt for an analytic representation which reflects the management of the time that employees work on the different client cases.
Example Representation of an Analytic Chart of Accounts for a Law Firm
- Absences
- Paid Absences
- Unpaid Absences
- Internal Projects
- Administrative
- Others
- Client Cases
- Client 1
- Case 1.1
- Case 1.2
- Client 2
- Case 2.1
All expenses and sales are then attached to a case. This gives the profitability of each case and, at a consolidated level, of each client.
Billing for the different cases is a bit unusual. The cases do not match any entry on the general account and nor do they come from purchase or sale invoices. They are represented by the various analytic operations and do not have exact counterparts in the general accounts. They are calculated on the basis of the hourly cost per employee. These entries are automatically created on billing worksheets.
At the end of the month when you pay salaries and benefits, you integrate them into the general accounts but not in the analytic accounts, because they have already been accounted for in billing each account. A report that relates data from the analytic and general accounts then lets you compare the totals, so you can readjust your estimates of hourly cost per employee depending on the time actually worked.
The following table gives an example of different analytic entries that you can find for your analytic account:
| Title | Account | Amount | General Account | Debit | Credit | |
|---|---|---|---|---|---|---|
|
Study the file (1 h) |
Case 1.1 |
-15 |
||||
|
Search for information (3 h) |
Case 1.1 |
-45 |
||||
|
Consultation (4 h) |
Case 2.1 |
-60 |
||||
|
Service charges |
Case 1.1 |
280 |
705 – Billing services |
280 |
||
|
Stationery purchase |
Administrative |
-42 |
601 – Furniture purchase |
42 |
||
|
Fuel Cost -Client trip |
Case 1.1 |
-35 |
613 – Transports |
35 |
||
|
Staff salaries |
6201 – Salaries |
3 000 |
You will see that it allows you to make a detailed study of the profitability of different transactions. In this example, the cost of Case 1.1 is 95.00 (the sum of the analytic costs of studying the files, searching for information and service charges), but has been invoiced for 280.00, which gives you a gross profit of 185.00.
But an interest in analytical accounts is not limited to a simple analysis of the profitability of different cases.
This same data can be used for automatic recharging of the services to the client at the end of the month. To invoice clients, just take the analytic costs in that month and apply a selling price factor to generate the invoice. Invoicing mechanisms for this are explained in greater detail in Deliver Quality Services. If the client requires details of the services used on the case, you can then print the service entries in the analytic account for this case.
Most software that manages billing enables you to recharge for hours worked. In Odoo ERPOnline, these services are automatically represented by analytic costs. But many other Odoo ERPOnline documents can also generate analytic costs, such as credit notes and purchases of goods.
So when you invoice the client at the end of the month, it is possible for you to include all the analytic costs, not just the hours worked. So, for example, you can easily recharge the whole cost of your journeys to the client.
Case 3: IT Services Company
Most IT service companies face the following problems:
- project planning,
- invoicing, profitability and financial follow-up of projects,
- managing support contracts.
To deal with these problems, you would use an analytic chart of accounts structured by project and by contract. A representation of that is given in the following example:
Example Analytic Representation of a Chart of Accounts for an IT Services Company
- Internal Projects
- Administrative and Commercial
- Research and Development
- Client Projects
- Client 1
- Project 1.1
- Project 1.2
- Client 2
- Project 2.1
- Project 2.2
- Support Contracts – 20h
- Customer X
- Customer Y
The management of services, expenditures and sales is similar to that presented above for lawyers. Invoicing and the study of profitability are also similar.
But now look at support contracts. These contracts are usually limited to a prepaid number of hours. Each service posted in the analytic accounts shows the remaining available hours of support. For the management of support contracts, you would use the quantities and not the amounts in the analytic entries.
In Odoo ERPOnline, each analytic line lists the number of units sold or used, as well as what you would usually find there – the amount in currency units (USD or GBP, or whatever other choice you make). So you can sum the quantities sold and used on each analytic account to determine whether any hours of the support contract remain.
To differentiate services from other costs in the analytic account, you use the concept of the analytic journal. Analytic entries are then allocated into the different journals:
- service journal,
- expense journal,
- sales journal,
- purchase journal.
So to obtain the detailed breakdown of a support contract, you only have to look at the service journal for the analytic account corresponding to the contract in question.
Finally, the analytic account can be used to forecast future needs. For example, monthly planning of staff on different projects can be seen as an analytic budget limited to the service journal. Accounting entries are expressed in quantities (such as number of hours, and numbers of products), and in amounts in units of currency (USD or GBP perhaps).
So you can set up planning on just the basis of quantities. Analyzing the analytic budget enables you to compare the budget (that is, your plan) to the services actually carried out by month end.
Problems of cash management are amongst the main difficulties encountered by small growing businesses. It is really difficult to predict the amount of cash that will be available when a company is young and rapidly growing.
If the company adopts management by case, then staff planning can be represented on the analytic accounts report, as you have seen.
But since you know your selling price for each of the different projects, you can see that it is easy to use the plan in the analytic accounts to more precisely forecast the amounts that you will invoice in the coming months.